The contents of this document should not be perceived as investment advice.

Why should investors consider natural capital?
Contents
Portfolio benefits
Natural capital can offer both long-established investment attributes and emerging strategic advantages:

Low correlation with traditional equities and bonds

Inflation protection through real asset exposure

Capital preservation via productive, finite land resources

Attractive risk adjusted returns supported by biological growth and low volatility
These benefits are well-recognised in agriculture and forestry. Increasingly, however, natural capital is also valued for its role in climate adaptation, regulatory alignment, and systemic risk mitigation, positioning it as a resilience anchor within institutional portfolios.
01a
Low correlation with traditional assets
Natural capital assets have consistently demonstrated low correlation with public markets. Their returns are largely driven by biological growth cycles, land productivity and commodity trends rather than macroeconomic shocks. This makes them powerful tools for portfolio diversification.
Correlation matrix of real and traditional assets 1995-2024
Equities

Bonds
Gold
Farmland
US Forestry
REITs
UK
Forestry
Inflation
-0.10
-0.21
0.05
0.27
0.31
-0.28
0.13
1.00
0.18
1.00
0.02
0.32
1.00
0.07
0.08
-0.28
0.82
-0.10
0.23
-0.09
1.00
1.00
0.57
0.24
0.10
-0.14
-0.04
1.00
-0.27
0.05
0.08
-0.18
-0.12
0.04
1.00
1.00

Equities
Bonds
Gold
Farmland
US Forestry
REITs
UK Forestry
Inflation

1
0.75
0.50
0.25
0
-0.25
-0.50
-0.75
-1
Sources: NCREIF; FTSE Nareit; LBMA; S&P Dow Jones Indices; Bloomberg; Bank of England; Office for National Statistics; Gresham House. Full source in references section. Past performance is not a guarantee or reliable indicator of future results.
01b
Capital preservation
Sustainably managed natural assets tend to retain or grow their intrinsic value over time. Their productivity is tied to essentials like food, fibre and raw materials, goods with persistent demand. These assets generate stable, uncorrelated income streams, helping to cushion portfolio losses during periods of financial market distress, such as the dot-com crash and the 2008 Global Financial Crisis.
Maximum drawdown by asset (from 1995-2024)
Farmland
US Forestry
Bonds
UK Forestry
Gold
S&P 500
REITs


-1.46%
-4.83%
-17.24%
-19.86%
-40.64%
-49.81%
-57.46%
-70%
-60%
-50%
-40%
-30%
-20%
-10%
0%
Max drawdown
Sources: NCREIF; FTSE Nareit; LBMA; S&P Dow Jones Indices; Bloomberg; Bank of England; Gresham House. Past performance is not a guarantee or reliable indicator of future results.
01c
Inflation hedge
Natural capital strategies offer strong inflation protection. Revenues from farmland and timberland are typically linked to commodity prices or inflation-indexed leases. As real assets, they help preserve purchasing power in inflationary environments.
Rolling 10-year correlation between inflation and farmland, with smoothed income and 10y treasury yield
KEY
Correlations
10y treasury yield
Smoothed farmland and income
Sources: NCREIF Farmland Index (total return); Office for National Statistics (UK CPI); Federal Reserve Economic Data (U.S. 10Y Treasury yield); Gresham House calculations. Past performance is not a guarantee or reliable indicator of future results.
01d
Attractive risk adjusted returns
Natural capital assets such as agriculture and forestry have historically outperformed equities and bonds on a risk-adjusted basis, with superior Sharpe ratios across regions and cycles. Performance data for nature-based solutions is still limited but developing.
Historical risk-adjusted volatility metrics (30-year)
Asset name
Mean Return
Volatility
Sharpe Ratio
Farmland
9.01%
7.01%
0.93
US Forestry
7.80%
7.02%
0.76
UK Forestry
11.57%
12.64%
0.72
Equities
11.83%
18.94%
0.49
REITs
9.46%
19.63%
0.35
Gold
6.48%
14.64%
0.27
Bonds
4.73%
8.29%
0.27
Sources: NCREIF; FTSE Nareit; LBMA; S&P Dow Jones Indices; Bloomberg; Bank of England; Gresham House. Past performance is not a guarantee or reliable indicator of future results.
01e
Climate alignment and portfolio resilience
Net zero targets are reshaping capital flows, regulation and investor mandates. Natural capital plays a critical role in delivery. Indeed, while emissions reductions remain essential, there is a growing recognition that carbon removal will also be vital to meet mid-century goals. Nature-based solutions are among the few scalable options for high-integrity removals, with afforestation, peatland restoration, and coastal projects generating credits for compliance and voluntary use. Sustainable agriculture and forestry also contribute through soil carbon gains and extended rotation cycles. These assets offer investors the flexibility to retain credits for internal decarbonisation or to monetise them, creating both financial and reputational value aligned with long-term climate goals.
92%
of LGPS respondents indicated, that in addition to financial returns, contributing to climate adaptation and mitigation is a leading reason to invest in natural capital.
(Gresham House and Mallow Street, 2024)
*An exchange rate of USD 1.00 = GBP 0.75 was applied for conversion purposes (02/09/2025).
Investments depend on ecosystems, and also influence those systems, both positively and negatively.
01f
Governance, disclosure and, ESG alignment
Natural capital can support ESG goals by mitigating systemic environmental risks, enhancing biodiversity, and strengthening rural economies. It aligns with regulatory frameworks such as ISSB, SFDR and, TNFD, helping investors meet growing disclosure requirements and integrate nature-related risks. Legal guidance from NatWest Cushion and Eversheds Sutherland confirms that pension trustees can consider broader economic and social factors, including climate change, when acting in members’ interests (Dohle, 2025). By delivering both measurable impact and financial returns, natural capital offers a practical route to align fiduciary duty with long-term sustainability commitments.
92%
of LGPS respondents indicated, that in addition to financial returns, contributing to climate adaptation and mitigation is a leading reason to invest in natural capital.
(Gresham House and Mallow Street, 2024)

Essex Pension Fund has invested in timberland as part of its £1 billion impact investing strategy, targeting a 4% allocation and securing carbon credits through this commitment (Room 151, 2023; Pensions Age, 2022).
Structural opportunities
Several long-term trends are reinforcing the strategic relevance of natural capital.
02a
Climate volatility
Climate change is amplifying the frequency and severity of extreme weather events, placing mounting pressure on production systems, infrastructure, and supply chains. These disruptions are reshaping global markets.
For well-capitalised investors, this is creating clear opportunities to deploy capital into resilience. From a land-based perspective, this includes owning sustainable land and water assets that can endure, or benefit from, climatic shifts, investing in climate-resilient production systems and infrastructure. In the face of volatility, assets that can dampen its impact while delivering consistent, reliable output or benefit (e.g. flood defense, drought mitigation) will capture disproportionate value, reinforcing a “winner-takes-all” dynamic that rewards resilience.
The intensity of droughts and floods is rising as global temperatures rise
Intensity of droughts and floods (km3 month)
8,000
6,000
4,000
2,000
0

2003
2005
2007
2009
2011
2013
2015
2017
2019
2021
2023
2025
+ 0.5°C
+ 1.3°C
Temperature above pre-industrial mean
Source: (Rodell et al., 2023; Global Water Intelligence and Xylem, 2025)
Source: (Rodell et al., 2023; Global Water Intelligence and Xylem, 2025)
5.7m
properties in England (1 in 6 businesses and homes) are now at risk of flooding.
(Environment Agency, 2023)
02b
Population growth and food security
Rising populations and changing diets are placing sustained pressure on food systems. At the same time, regulation and consumer demand are driving a shift towards agricultural models that reduce emissions and environmental harm. This is reinforcing long-term investor interest in productive, regenerative land use.
Agricultural land per capita since 1961 (Ritchie and Roser, 2019)
2023
2030
Animal protein & feed
1.2x
Minerals 4x
Renewables
15x
Biofuels & Plastic
4x
Food & Fibre
1.2x
Source: BloombergNEF (uses the same population, GDP and food demand assumptions in both scenarios. Total land demand comparison is illustrative as demand categories are not necessarily additive. Renewables are wind and solar, biofuels include plastics).
02c
Land and water scarcity
Climate change, degradation and rising demand are intensifying pressure on land and freshwater. Agriculture’s reliance on water is straining global reserves, making resource-efficient, regenerative assets more valuable. Water scarcity is also disrupting industries such as utilities and manufacturing, raising costs and constraining growth across economies (World Economic Forum, 2024).
Agricultural land per capita since 1961 (Ritchie and Roser, 2019)
KEY
North America
Europe and Central Asia
Latin America and Caribbean
Sub-Saharan Africa
World
Middle East and North Africa
South Asia
East Asia and Pacific
Source: (Ritchie and Roser, 2019)
02d
Deglobalisation and regional resilience
Net zero targets are reshaping capital flows, regulation and investor mandates. Natural capital plays a critical role in delivery. Indeed, while emissions reductions remain essential, there is a growing recognition that carbon removal will also be vital to meet mid-century goals. Nature-based solutions are among the few scalable options for high-integrity removals, with afforestation, peatland restoration, and coastal projects generating credits for compliance and voluntary use. Sustainable agriculture and forestry also contribute through soil carbon gains and extended rotation cycles. These assets offer investors the flexibility to retain credits for internal decarbonisation or to monetise them, creating both financial and reputational value aligned with long-term climate goals.
02e
Carbon market access
and policy exposure
As net-zero targets expand, demand is growing for land-based carbon removals backed by clear standards and policy support. Strategies such as afforestation, peatland restoration and, blue carbon are generating verifiable credits for compliance and voluntary markets. These projects offer long-term revenue potential tied to regulation and decarbonisation goals, with return profiles distinct from traditional asset classes. However, carbon pricing remains volatile and difficult to fully bank today, meaning that revenue forecasts should be approached with caution.
24%
of global emissions are covered by a carbon market, while 76% of emissions are covered by a net-zero target.
(WorldBank, 2024; Committee on Climate Change, 2025)
These trends are not cyclical, they’re structural. Together, they point to sustained demand for natural capital investments that combine resilience, productivity and measurable environmental value.


The contents of this document should not be perceived as investment advice.

Why should investors consider natural capital?
Contents
Portfolio benefits
Natural capital can offer both long-established investment attributes and emerging strategic advantages:
Low correlation with traditional equities and bonds
Inflation protection through real asset exposure
Capital preservation via productive, finite land resources
Attractive risk adjusted returns supported by biological growth and low volatility
These benefits are well-recognised in agriculture and forestry. Increasingly, however, natural capital is also valued for its role in climate adaptation, regulatory alignment, and systemic risk mitigation, positioning it as a resilience anchor within institutional portfolios.
01a
Low correlation with traditional assets
Natural capital assets have consistently demonstrated low correlation with public markets. Their returns are largely driven by biological growth cycles, land productivity and commodity trends rather than macroeconomic shocks. This makes them powerful tools for portfolio diversification.
Correlation matrix of real and traditional assets 1995-2024
Equities

Bonds
Gold
Farmland
US Forestry
REITs
UK
Forestry
Inflation
-0.10
-0.21
0.05
0.27
0.31
-0.28
0.13
1.00
0.18
1.00
0.02
0.32
1.00
0.07
0.08
-0.28
0.82
-0.10
0.23
-0.09
1.00
1.00
0.57
0.24
0.10
-0.14
-0.04
1.00
-0.27
0.05
0.08
-0.18
-0.12
0.04
1.00
1.00

Equities
Bonds
Gold
Farmland
US Forestry
REITs
UK Forestry
Inflation

1
0.75
0.50
0.25
0
-0.25
-0.50
-0.75
-1
Sources: NCREIF; FTSE Nareit; LBMA; S&P Dow Jones Indices; Bloomberg; Bank of England; Office for National Statistics; Gresham House. Full source in references section. Past performance is not a guarantee or reliable indicator of future results.
01b
Capital preservation
Sustainably managed natural assets tend to retain or grow their intrinsic value over time. Their productivity is tied to essentials like food, fibre and raw materials, goods with persistent demand. These assets generate stable, uncorrelated income streams, helping to cushion portfolio losses during periods of financial market distress, such as the dot-com crash and the 2008 Global Financial Crisis.
Maximum drawdown by asset (from 1995-2024)
Farmland
US Forestry
Bonds
UK Forestry
Gold
S&P 500
REITs


-1.46%
-4.83%
-17.24%
-19.86%
-40.64%
-49.81%
-57.46%
-70%
-60%
-50%
-40%
-30%
-20%
-10%
0%
Max drawdown
Sources: NCREIF; FTSE Nareit; LBMA; S&P Dow Jones Indices; Bloomberg; Bank of England; Gresham House. Past performance is not a guarantee or reliable indicator of future results.
01c
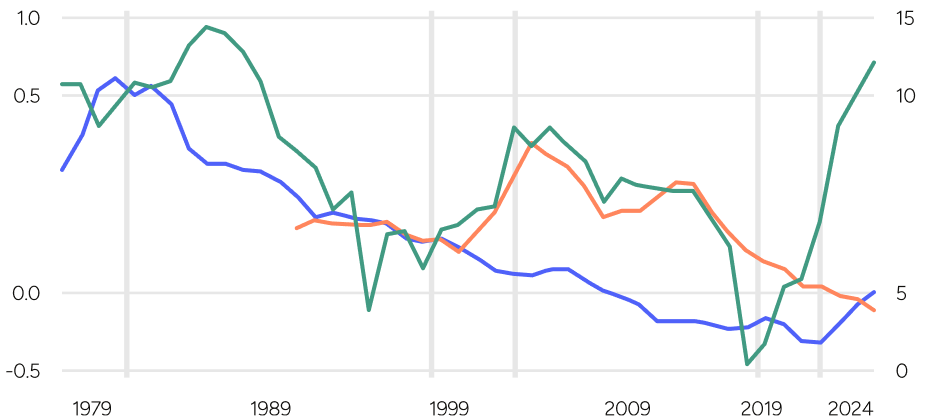
Inflation hedge
Natural capital strategies offer strong inflation protection. Revenues from farmland and timberland are typically linked to commodity prices or inflation-indexed leases. As real assets, they help preserve purchasing power in inflationary environments.
Rolling 10-year correlation between inflation and farmland, with smoothed income and 10y treasury yield
KEY
Correlations
10y treasury yield
Smoothed farmland and income
Sources: NCREIF Farmland Index (total return); Office for National Statistics (UK CPI); Federal Reserve Economic Data (U.S. 10Y Treasury yield); Gresham House calculations. Past performance is not a guarantee or reliable indicator of future results.
01d
Attractive risk adjusted returns
Natural capital assets such as agriculture and forestry have historically outperformed equities and bonds on a risk-adjusted basis, with superior Sharpe ratios across regions and cycles. Performance data for nature-based solutions is still limited but developing.
Historical risk-adjusted volatility metrics (30-year)
Asset name
Mean Return
Volatility
Sharpe Ratio
Farmland
9.01%
7.01%
0.93
US Forestry
7.80%
7.02%
0.76
UK Forestry
11.57%
12.64%
0.72
Equities
11.83%
18.94%
0.49
REITs
9.46%
19.63%
0.35
Gold
6.48%
14.64%
0.27
Bonds
4.73%
8.29%
0.27
Sources: NCREIF; FTSE Nareit; LBMA; S&P Dow Jones Indices; Bloomberg; Bank of England; Gresham House. Past performance is not a guarantee or reliable indicator of future results.
01e
Climate alignment and portfolio resilience
Net zero targets are reshaping capital flows, regulation and investor mandates. Natural capital plays a critical role in delivery. Indeed, while emissions reductions remain essential, there is a growing recognition that carbon removal will also be vital to meet mid-century goals. Nature-based solutions are among the few scalable options for high-integrity removals, with afforestation, peatland restoration, and coastal projects generating credits for compliance and voluntary use. Sustainable agriculture and forestry also contribute through soil carbon gains and extended rotation cycles. These assets offer investors the flexibility to retain credits for internal decarbonisation or to monetise them, creating both financial and reputational value aligned with long-term climate goals.
£420–458bn*
of LGPS respondents indicated, that in addition to financial returns, contributing to climate adaptation and mitigation is a leading reason to invest in natural capital.
(Gresham House and Mallow Street, 2024)
*An exchange rate of USD 1.00 = GBP 0.75 was applied for conversion purposes (02/09/2025).
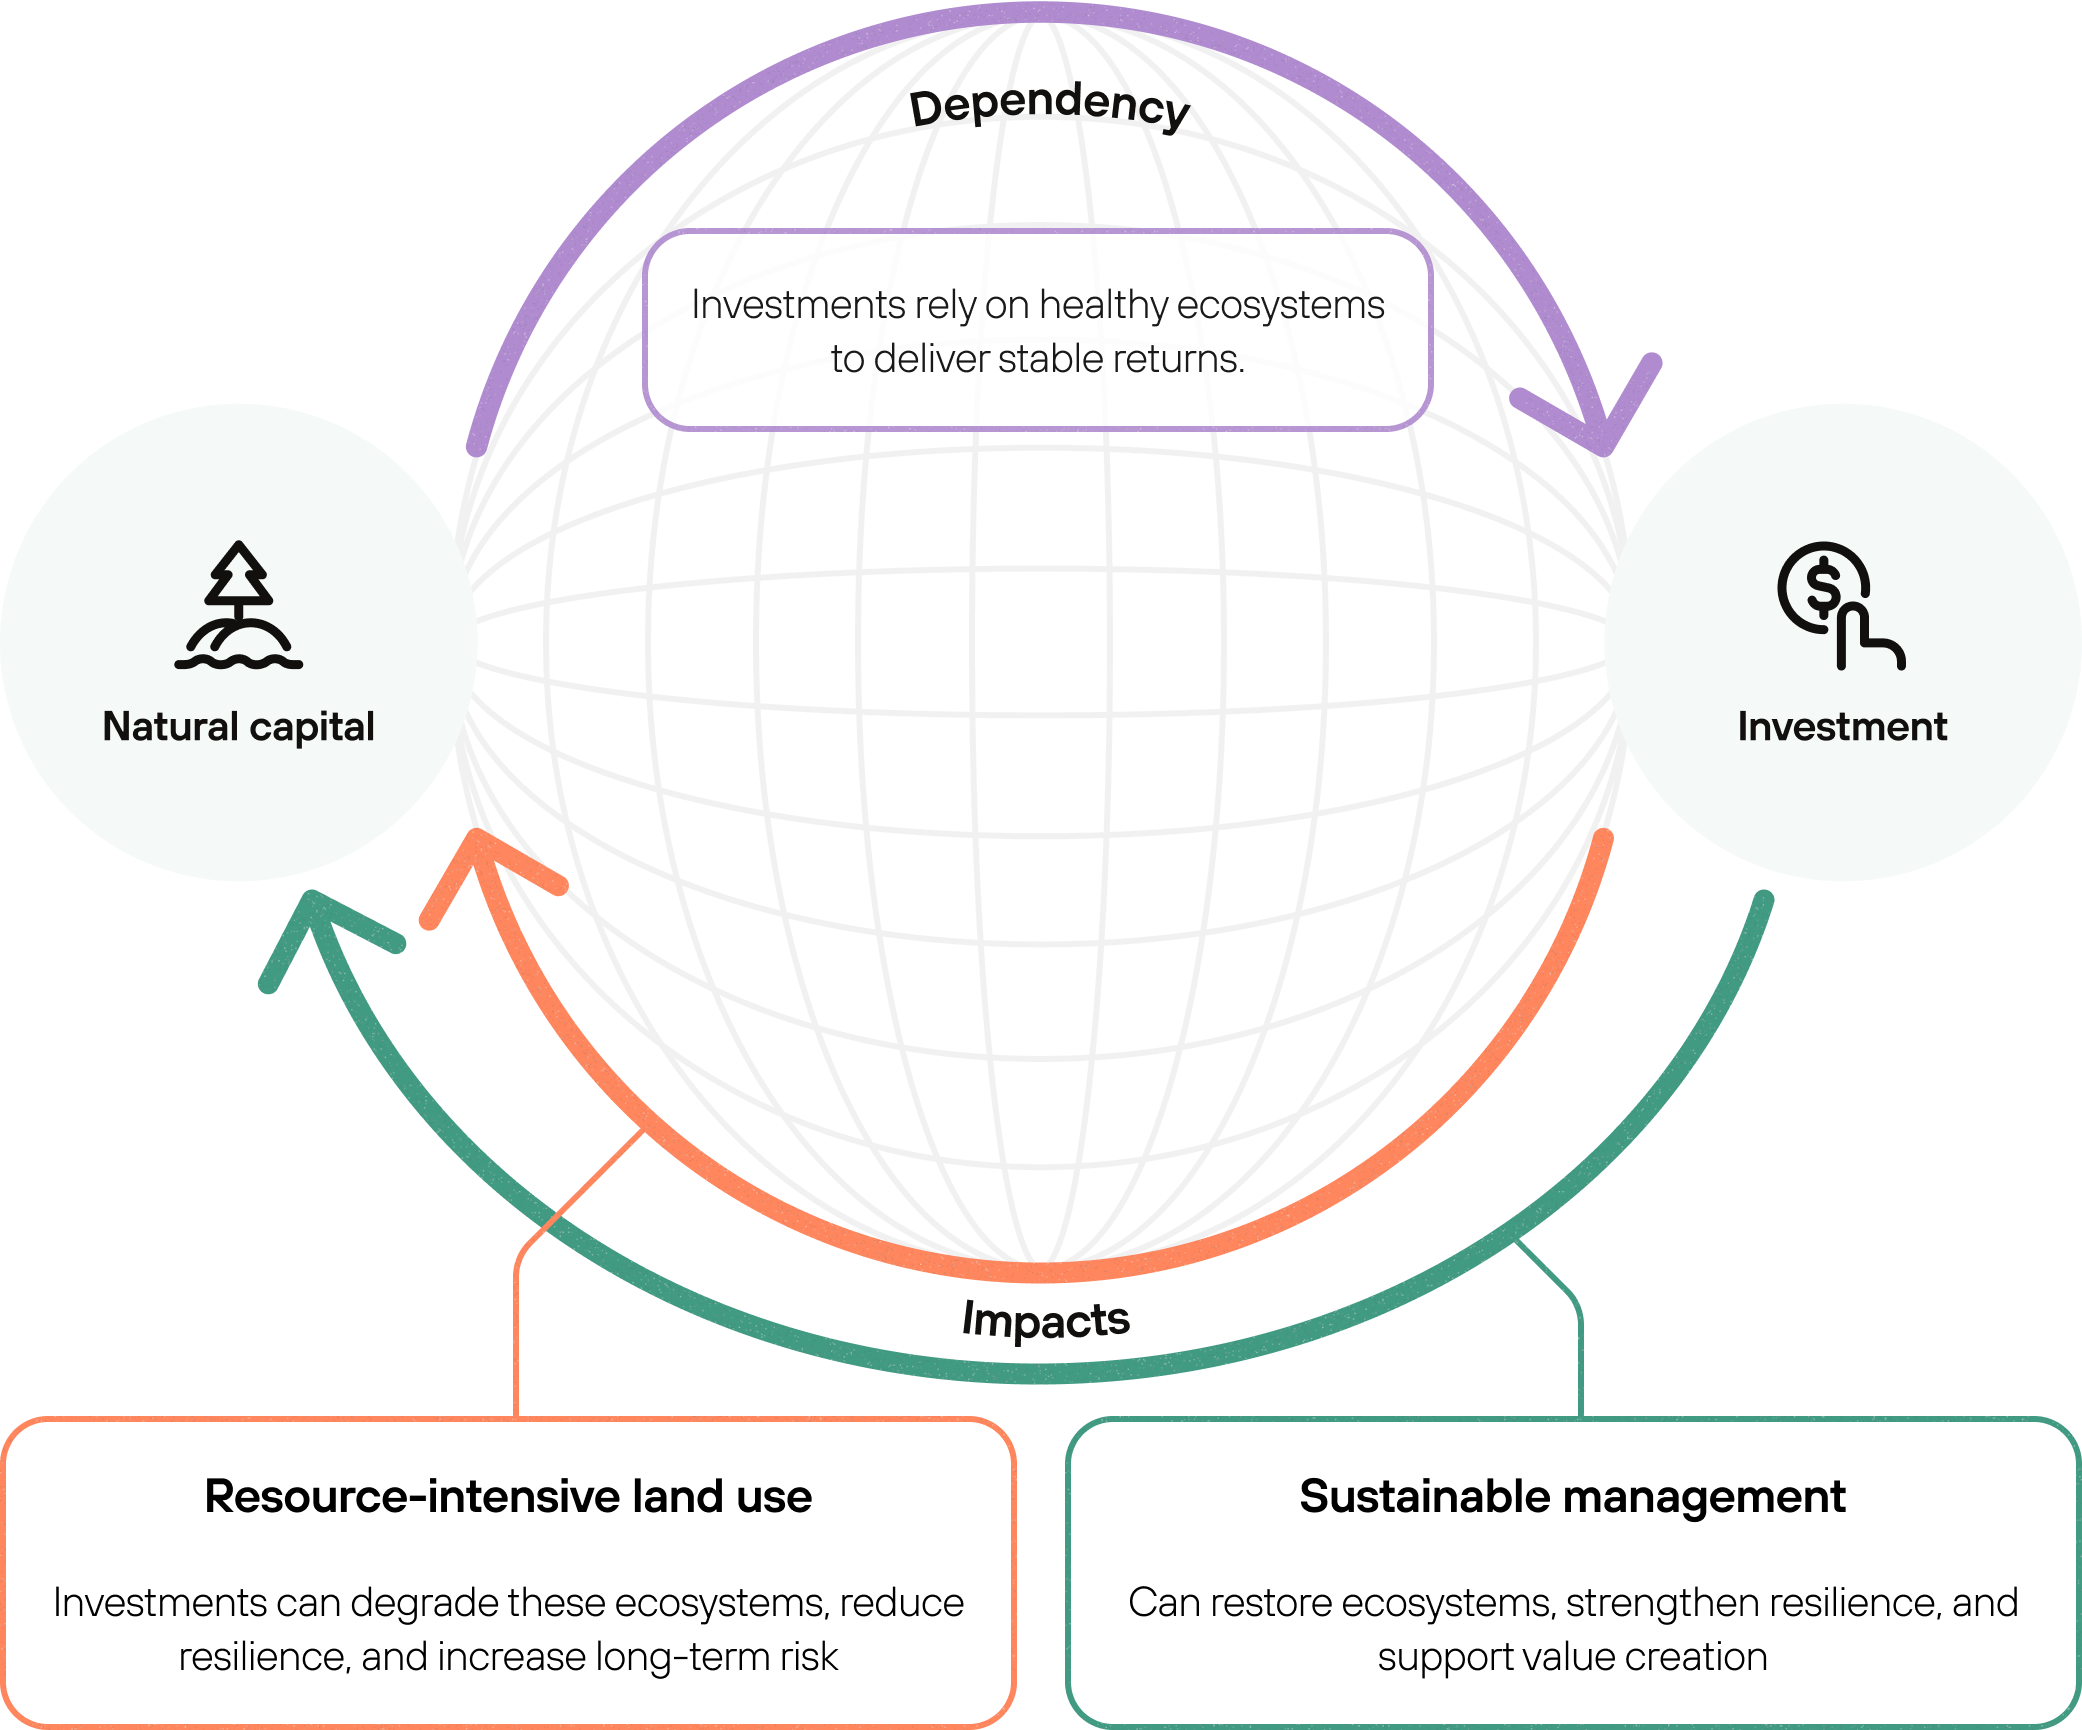
Investments depend on ecosystems, and also influence those systems, both positively and negatively.


Natural capital

Investment
Resource-intensive land use
Investments can degrade these ecosystems, reduce resilience, and increase long-term risk
Sustainable management
Can restore ecosystems, strengthen resilience, and support value creation


Investments rely on healthy ecosystems to deliver stable returns.
01f
Governance, disclosure and, ESG alignment
Natural capital can support ESG goals by mitigating systemic environmental risks, enhancing biodiversity, and strengthening rural economies. It aligns with regulatory frameworks such as ISSB, SFDR and, TNFD, helping investors meet growing disclosure requirements and integrate nature-related risks. Legal guidance from NatWest Cushion and Eversheds Sutherland confirms that pension trustees can consider broader economic and social factors, including climate change, when acting in members’ interests (Dohle, 2025). By delivering both measurable impact and financial returns, natural capital offers a practical route to align fiduciary duty with long-term sustainability commitments.
92%
of LGPS respondents indicated, that in addition to financial returns, contributing to climate adaptation and mitigation is a leading reason to invest in natural capital.
(Gresham House and Mallow Street, 2024)
Essex Pension Fund has invested in timberland as part of its £1 billion impact investing strategy, targeting a 4% allocation and securing carbon credits through this commitment (Room 151, 2023; Pensions Age, 2022).
Structural opportunities
Several long-term trends are reinforcing the strategic relevance of natural capital.
02a
Climate volatility
Climate change is amplifying the frequency and severity of extreme weather events, placing mounting pressure on production systems, infrastructure, and supply chains. These disruptions are reshaping global markets.
For well-capitalised investors, this is creating clear opportunities to deploy capital into resilience. From a land-based perspective, this includes owning sustainable land and water assets that can endure, or benefit from, climatic shifts, investing in climate-resilient production systems and infrastructure. In the face of volatility, assets that can dampen its impact while delivering consistent, reliable output or benefit (e.g. flood defense, drought mitigation) will capture disproportionate value, reinforcing a “winner-takes-all” dynamic that rewards resilience.
The intensity of droughts and floods is rising as global temperatures rise
Intensity of droughts and floods (km3 month)
8,000
6,000
4,000
2,000
0

2003
2005
2007
2009
2011
2013
2015
2017
2019
2021
2023
2025
+ 0.5°C
+ 1.3°C
Temperature above pre-industrial mean
Source: (Rodell et al., 2023; Global Water Intelligence and Xylem, 2025)
Source: (Rodell et al., 2023; Global Water Intelligence and Xylem, 2025)
5.7m
properties in England (1 in 6 businesses and homes) are now at risk of flooding.
(Environment Agency, 2023)
02b
Population growth and food security
Rising populations and changing diets are placing sustained pressure on food systems. At the same time, regulation and consumer demand are driving a shift towards agricultural models that reduce emissions and environmental harm. This is reinforcing long-term investor interest in productive, regenerative land use.
Agricultural land per capita since 1961 (Ritchie and Roser, 2019)
2023
2030
Animal protein & feed
1.2x
Minerals 4x
Renewables
15x
Biofuels & Plastic
4x
Food & Fibre
1.2x
Source: BloombergNEF (uses the same population, GDP and food demand assumptions in both scenarios. Total land demand comparison is illustrative as demand categories are not necessarily additive. Renewables are wind and solar, biofuels include plastics).
02c
Land and water scarcity
Climate change, degradation and rising demand are intensifying pressure on land and freshwater. Agriculture’s reliance on water is straining global reserves, making resource-efficient, regenerative assets more valuable. Water scarcity is also disrupting industries such as utilities and manufacturing, raising costs and constraining growth across economies (World Economic Forum, 2024).
Agricultural land per capita since 1961 (Ritchie and Roser, 2019)
KEY
North America
Europe and Central Asia
Latin America and Caribbean
Sub-Saharan Africa
World
Middle East and North Africa
South Asia
East Asia and Pacific
Source: (Ritchie and Roser, 2019)
02d
Deglobalisation and regional resilience
Net zero targets are reshaping capital flows, regulation and investor mandates. Natural capital plays a critical role in delivery. Indeed, while emissions reductions remain essential, there is a growing recognition that carbon removal will also be vital to meet mid-century goals. Nature-based solutions are among the few scalable options for high-integrity removals, with afforestation, peatland restoration, and coastal projects generating credits for compliance and voluntary use. Sustainable agriculture and forestry also contribute through soil carbon gains and extended rotation cycles. These assets offer investors the flexibility to retain credits for internal decarbonisation or to monetise them, creating both financial and reputational value aligned with long-term climate goals.
02e
Carbon market access
and policy exposure
As net-zero targets expand, demand is growing for land-based carbon removals backed by clear standards and policy support. Strategies such as afforestation, peatland restoration and, blue carbon are generating verifiable credits for compliance and voluntary markets. These projects offer long-term revenue potential tied to regulation and decarbonisation goals, with return profiles distinct from traditional asset classes. However, carbon pricing remains volatile and difficult to fully bank today, meaning that revenue forecasts should be approached with caution.
24%
of global emissions are covered by a carbon market, while 76% of emissions are covered by a net-zero target.
(WorldBank, 2024; Committee on Climate Change, 2025)
These trends are not cyclical, they’re structural. Together, they point to sustained demand for natural capital investments that combine resilience, productivity and measurable environmental value.
The contents of this document should not be perceived as investment advice.

Why should investors consider natural capital?
Contents
Portfolio benefits
Natural capital can offer both long-established investment attributes and emerging strategic advantages:

Low correlation with traditional equities and bonds

Inflation protection through real asset exposure

Capital preservation via productive, finite land resources

Attractive risk adjusted returns supported by biological growth and low volatility
These benefits are well-recognised in agriculture and forestry. Increasingly, however, natural capital is also valued for its role in climate adaptation, regulatory alignment, and systemic risk mitigation, positioning it as a resilience anchor within institutional portfolios.
01a
Low correlation with traditional assets
Natural capital assets have consistently demonstrated low correlation with public markets. Their returns are largely driven by biological growth cycles, land productivity and commodity trends rather than macroeconomic shocks. This makes them powerful tools for portfolio diversification.
Correlation matrix of real and traditional assets 1995-2024
Equities

Bonds
Gold
Farmland
US Forestry
REITs
UK
Forestry
Inflation
-0.10
-0.21
0.05
0.27
0.31
-0.28
0.13
1.00
0.18
1.00
0.02
0.32
1.00
0.07
0.08
-0.28
0.82
-0.10
0.23
-0.09
1.00
1.00
0.57
0.24
0.10
-0.14
-0.04
1.00
-0.27
0.05
0.08
-0.18
-0.12
0.04
1.00
1.00

Equities
Bonds
Gold
Farmland
US Forestry
REITs
UK Forestry
Inflation

1
0.75
0.50
0.25
0
-0.25
-0.50
-0.75
-1
Sources: NCREIF; FTSE Nareit; LBMA; S&P Dow Jones Indices; Bloomberg; Bank of England; Office for National Statistics; Gresham House. Full source in references section. Past performance is not a guarantee or reliable indicator of future results.
01b
Capital preservation
Sustainably managed natural assets tend to retain or grow their intrinsic value over time. Their productivity is tied to essentials like food, fibre and raw materials, goods with persistent demand. These assets generate stable, uncorrelated income streams, helping to cushion portfolio losses during periods of financial market distress, such as the dot-com crash and the 2008 Global Financial Crisis.
Maximum drawdown by asset (from 1995-2024)
Farmland
US Forestry
Bonds
UK Forestry
Gold
S&P 500
REITs


-1.46%
-4.83%
-17.24%
-19.86%
-40.64%
-49.81%
-57.46%
-70%
-60%
-50%
-40%
-30%
-20%
-10%
0%
Max drawdown
Sources: NCREIF; FTSE Nareit; LBMA; S&P Dow Jones Indices; Bloomberg; Bank of England; Gresham House. Past performance is not a guarantee or reliable indicator of future results.
01c
Inflation hedge
Natural capital strategies offer strong inflation protection. Revenues from farmland and timberland are typically linked to commodity prices or inflation-indexed leases. As real assets, they help preserve purchasing power in inflationary environments.
Rolling 10-year correlation between inflation and farmland, with smoothed income and 10y treasury yield
KEY
Correlations
10y treasury yield
Smoothed farmland and income
Sources: NCREIF Farmland Index (total return); Office for National Statistics (UK CPI); Federal Reserve Economic Data (U.S. 10Y Treasury yield); Gresham House calculations. Past performance is not a guarantee or reliable indicator of future results.
01d
Attractive risk adjusted returns
Natural capital assets such as agriculture and forestry have historically outperformed equities and bonds on a risk-adjusted basis, with superior Sharpe ratios across regions and cycles. Performance data for nature-based solutions is still limited but developing.
Historical risk-adjusted volatility metrics (30-year)
Asset name
Mean Return
Volatility
Sharpe Ratio
Farmland
9.01%
7.01%
0.93
US Forestry
7.80%
7.02%
0.76
UK Forestry
11.57%
12.64%
0.72
Equities
11.83%
18.94%
0.49
REITs
9.46%
19.63%
0.35
Gold
6.48%
14.64%
0.27
Bonds
4.73%
8.29%
0.27
Sources: NCREIF; FTSE Nareit; LBMA; S&P Dow Jones Indices; Bloomberg; Bank of England; Gresham House. Past performance is not a guarantee or reliable indicator of future results.
01e
Climate alignment and portfolio resilience
Natural capital enables both decarbonisation and climate adaptation by providing access to carbon removal solutions such as afforestation and soil restoration, alongside land assets that support biodiversity and ecosystem stability. As ecosystems decline, long-term portfolio impacts are becoming more visible and measurable (University of Exeter and Institute and Faculty of Actuaries, 2025). These strategies help deliver net zero targets, manage physical climate risks, and strengthen long-term portfolio resilience. This flexibility adds to the strategic value of natural capital, aligning climate goals with the fundamentals of real asset investing.
£420–458bn*
of LGPS respondents indicated, that in addition to financial returns, contributing to climate adaptation and mitigation is a leading reason to invest in natural capital.
(Gresham House and Mallow Street, 2024)
*An exchange rate of USD 1.00 = GBP 0.75 was applied for conversion purposes (02/09/2025).
Investments depend on ecosystems, and also influence those systems, both positively and negatively.

Natural capital
Investment
Resource-intensive land use
Investments can degrade these ecosystems, reduce resilience, and increase long-term risk
Sustainable management
Can restore ecosystems, strengthen resilience, and support value creation
Investments rely on healthy ecosystems to deliver stable returns.
01f
Governance, disclosure and, ESG alignment
Natural capital can support ESG goals by mitigating systemic environmental risks, enhancing biodiversity, and strengthening rural economies. It aligns with regulatory frameworks such as ISSB, SFDR and, TNFD, helping investors meet growing disclosure requirements and integrate nature-related risks. Legal guidance from NatWest Cushion and Eversheds Sutherland confirms that pension trustees can consider broader economic and social factors, including climate change, when acting in members’ interests (Dohle, 2025). By delivering both measurable impact and financial returns, natural capital offers a practical route to align fiduciary duty with long-term sustainability commitments.
92%
of LGPS respondents indicated, that in addition to financial returns, contributing to climate adaptation and mitigation is a leading reason to invest in natural capital.
(Gresham House and Mallow Street, 2024)
Essex Pension Fund has invested in timberland as part of its £1 billion impact investing strategy, targeting a 4% allocation and securing carbon credits through this commitment (Room 151, 2023; Pensions Age, 2022).
Structural opportunities
Several long-term trends are reinforcing the strategic relevance of natural capital.
02a
Climate volatility
Climate change is amplifying the frequency and severity of extreme weather events, placing mounting pressure on production systems, infrastructure, and supply chains. These disruptions are reshaping global markets.
For well-capitalised investors, this is creating clear opportunities to deploy capital into resilience. From a land-based perspective, this includes owning sustainable land and water assets that can endure, or benefit from, climatic shifts, investing in climate-resilient production systems and infrastructure. In the face of volatility, assets that can dampen its impact while delivering consistent, reliable output or benefit (e.g. flood defense, drought mitigation) will capture disproportionate value, reinforcing a “winner-takes-all” dynamic that rewards resilience.
The intensity of droughts and floods is rising as global temperatures rise
Intensity of droughts and floods (km3 month)
8,000
6,000
4,000
2,000
0

2003
2005
2007
2009
2011
2013
2015
2017
2019
2021
2023
2025
+ 0.5°C
+ 1.3°C
Temperature above pre-industrial mean
Source: (Rodell et al., 2023; Global Water Intelligence and Xylem, 2025)
Source: (Rodell et al., 2023; Global Water Intelligence and Xylem, 2025)
5.7m
properties in England (1 in 6 businesses and homes) are now at risk of flooding.
(Environment Agency, 2023)
02b
Population growth and food security
Rising populations and changing diets are placing sustained pressure on food systems. At the same time, regulation and consumer demand are driving a shift towards agricultural models that reduce emissions and environmental harm. This is reinforcing long-term investor interest in productive, regenerative land use.
Land use requirements increase between 2023 and 2030
2023
2030
Animal protein & feed
1.2x
Minerals 4x
Renewables
15x
Biofuels & Plastic
4x
Food & Fibre
1.2x
Source: BloombergNEF (uses the same population, GDP and food demand assumptions in both scenarios. Total land demand comparison is illustrative as demand categories are not necessarily additive. Renewables are wind and solar, biofuels include plastics).
02c
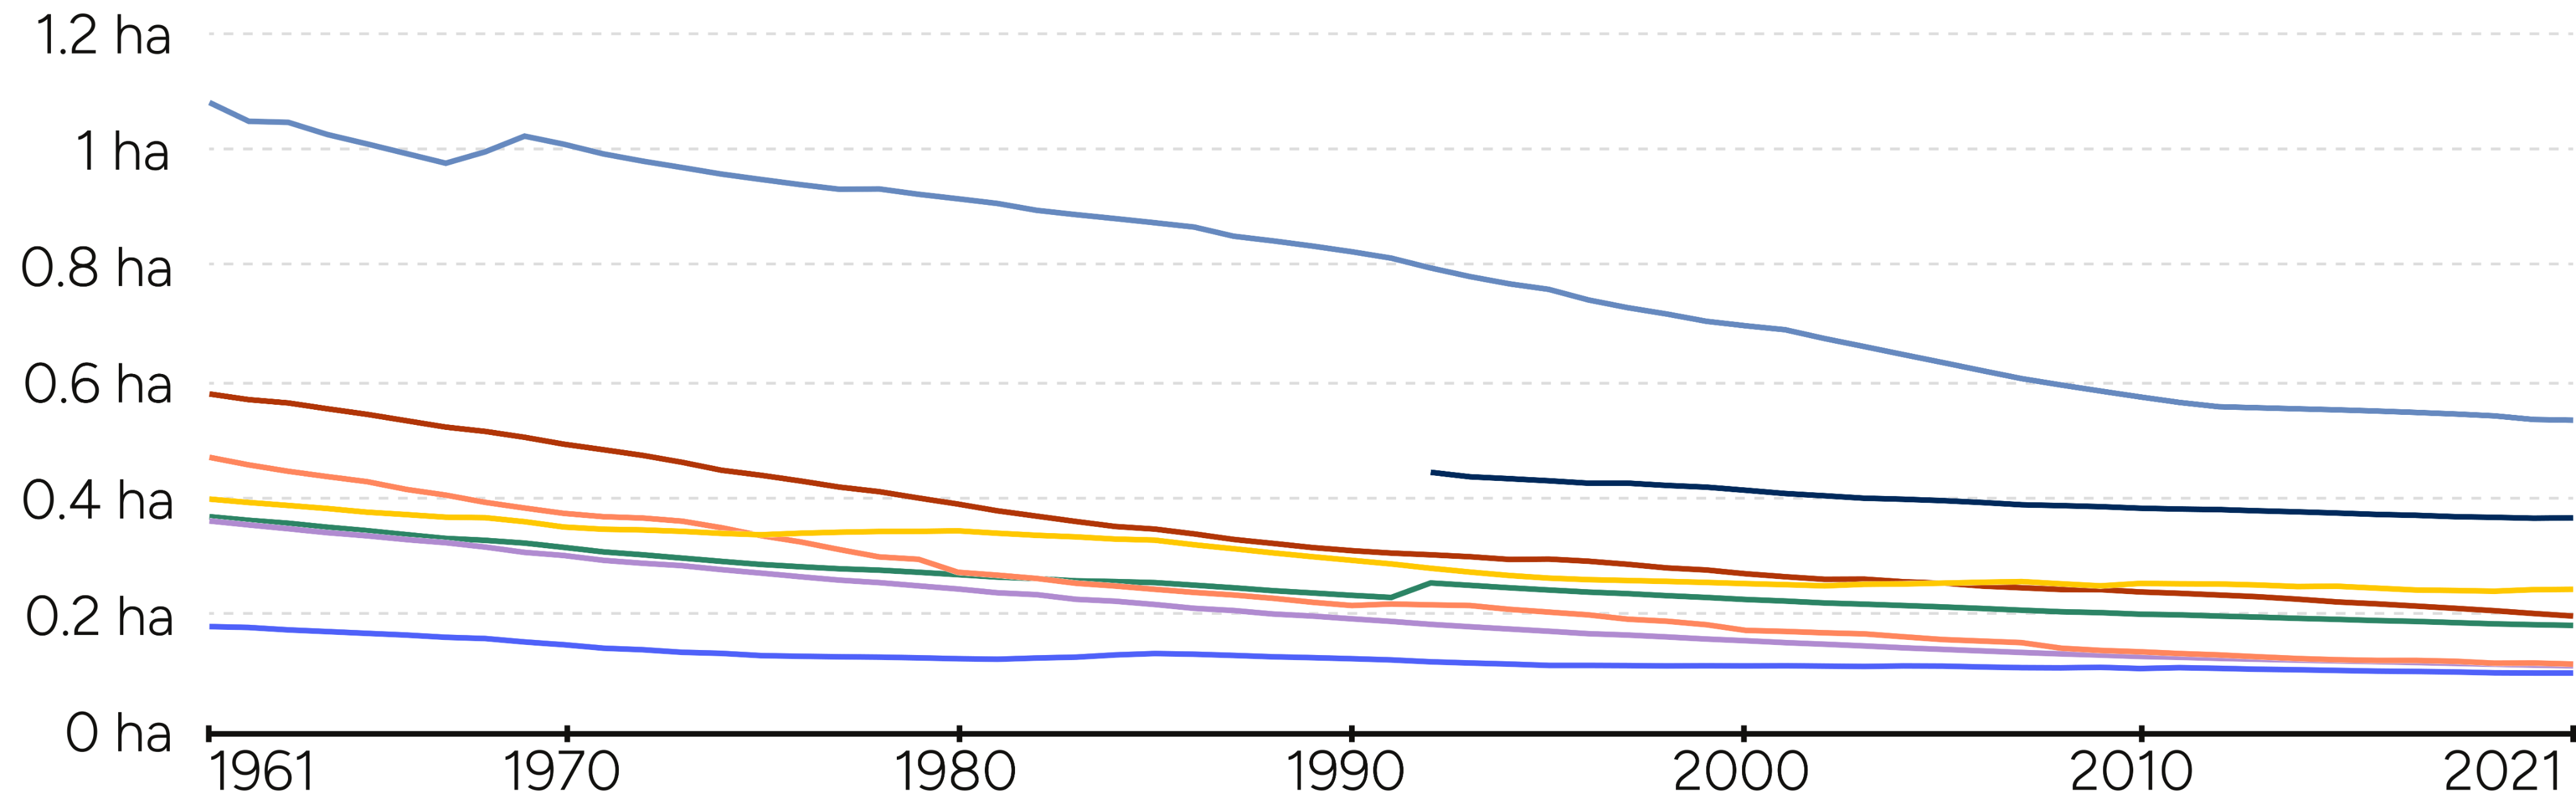
Land and water scarcity
Climate change, degradation and rising demand are intensifying pressure on land and freshwater. Agriculture’s reliance on water is straining global reserves, making resource-efficient, regenerative assets more valuable. Water scarcity is also disrupting industries such as utilities and manufacturing, raising costs and constraining growth across economies (World Economic Forum, 2024).
Agricultural land per capita since 1961
KEY
North America
Europe and Central Asia
Latin America and Caribbean
Sub-Saharan Africa
World
Middle East and North Africa
South Asia
East Asia and Pacific
Source: (Ritchie and Roser, 2019)
02d
Deglobalisation and regional resilience
Geopolitical shocks, pandemics and supply chain disruptions have exposed vulnerabilities in global trade. In response, governments and businesses are prioritising domestic production and resource security. Agriculture, forestry and nature-based infrastructure are increasingly seen as strategic assets, supporting economic resilience and national self-sufficiency.
02e
Carbon market access and policy exposure
As net-zero targets expand, demand is growing for land-based carbon removals backed by clear standards and policy support. Strategies such as afforestation, peatland restoration and, blue carbon are generating verifiable credits for compliance and voluntary markets. These projects offer long-term revenue potential tied to regulation and decarbonisation goals, with return profiles distinct from traditional asset classes. However, carbon pricing remains volatile and difficult to fully bank today, meaning that revenue forecasts should be approached with caution.
24%
of global emissions are covered by a carbon market, while 76% of emissions are covered by a net-zero target.
(WorldBank, 2024; Committee on Climate Change, 2025)
These trends are not cyclical, they’re structural. Together, they point to sustained demand for natural capital investments that combine resilience, productivity and measurable environmental value.